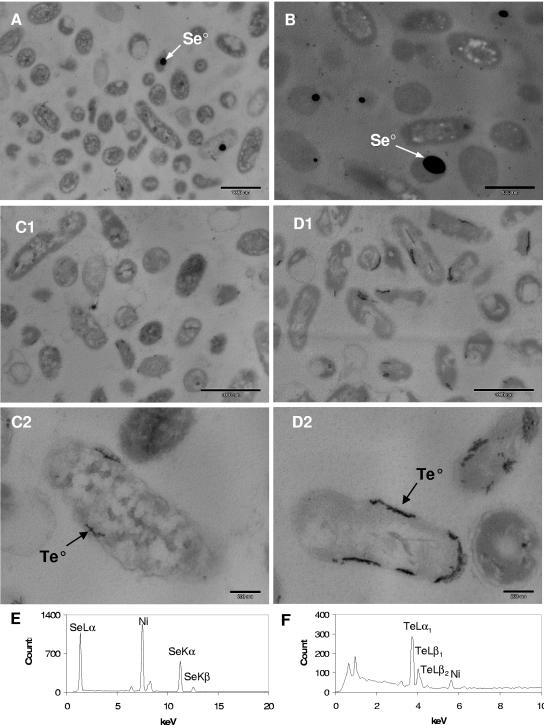
FIG. 5.
TEM images of bacteria grown in the presence of selenite and tellurite. (A) P. stutzeri KC at 0.5 mM selenite; (B) P. stutzeri CTN1 at 0.5 mM selenite; (C1 and C2) P. stutzeri KC at 0.05 mM tellurite; (D1 and D2) P. stutzeri CTN1 at 0.05 mM tellurite. Arrows indicate Se0 and Te0 deposits localized in the electron-dense particles inside the cells. The compositions of the deposits were confirmed by EDS analysis. (E) Spectrum of intracellular Se0 deposit; (F) spectrum of intracellular Te0 deposit. The Ni signal is due to the grid used for microscopy.

