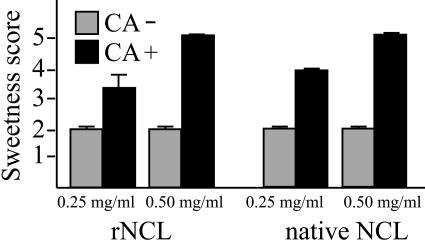
FIG. 5.
Taste-modifying activity assay. Gray columns show intensities of the original sweetness of rNCL (left) and native NCL (right). Black columns show the sweetness intensities when added with 100 mM citrate buffer (pH 4.0) (CA) shortly after the disappearance of the original sweetness of NCL. The sweetness scores are shown as means ± standard deviations (error bars) (n = 3). (Sweetness scores were determined as follows: 5, very strong; 4, strong; 3, moderate; 2, weak; and 1, not sweet).

