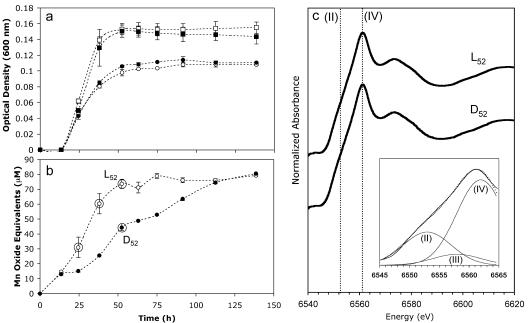
FIG. 2.
Growth of (a) and Mn(II) oxidation by (b) AzwK-3b over time. Duplicate cultures were incubated in the light (open symbols) or in the dark (solid symbols) in the presence (circles) or in the absence (squares) of 100 μM MnCl2. Cell density (a) was determined by adding 200 μM ascorbic acid to remove Mn oxides prior to measurement of the optical density at 600 nm. The first standard deviations for duplicate cultures are indicated by error bars. The circled data points in panel b indicate times when XANES analysis was performed. (c) Manganese K-edge XANES spectra of filtered particulates (pore size, >0.2 μm) produced in the light (L52) and in the dark (D52) following 52 h of incubation. The dotted lines indicate maximum edge positions for Mn(II) and Mn(IV). (Inset) Three-component Gaussian fit (dotted line) to the absorption edge of D52 (solid line) using binding energy positions indicative of Mn(II) (6,553 eV), Mn(III) (6,558 eV, approximate), and Mn(IV) (6,562 eV).

