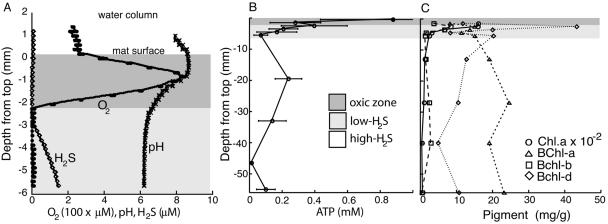
FIG. 1.
Chemical and biochemical characteristics of the mat as a function of depth. (A) Microelectrode measurements of O2 and H2S concentrations and pH. (B) ATP concentrations. Means of three independent measurements are plotted; the bars show standard errors. (C) Pigment concentrations. For all measurements, October values are plotted; the June values were equivalent (data not shown).

