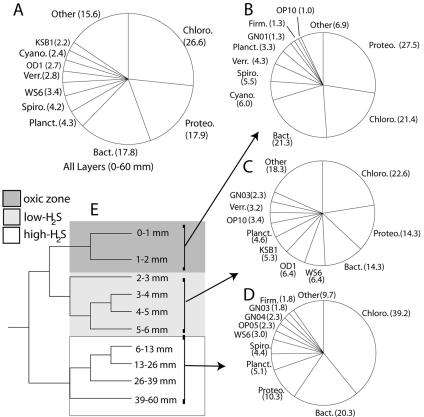
FIG. 3.
Bacterial diversity in the mat. Proportions of bacterial phyla in the total data set (A), in the oxic zone (0 to 2 mm) (B), in the low-H2S zone (2 to 6 mm) (C), and in the H2S-rich zone (6 to 60 mm) (D) are shown. Others: cyanobacteria, KSB1, OP10, GN03, OP5, GN1, Firmicutes, OP11, GN04, GN05, GN09, GN10, WS1, WS2, GN2, Deinococcus-Thermus, GN07, Haloanaerobiales, GN06, GN11, BRC1, OP8, OS-K, GN12, GN13, GN14, actinobacteria, GN15, WS3, GN8, OP9, TM6, and VadinBE97. Abbreviations: Chloro., Chloroflexi; Cyano., Cyanobacteria; Verr., Verrucomicrobia; Planct., Planctomycetales; Spiro., Spirochaetales; Firm., Firmicutes, Bact., Bacteroidetes; Proteo., Proteobacteria. (E) Bacterial community clustering by layer studied (UPGMA tree of UniFrac metric based on 1,585 16S rRNA gene sequences). Shaded areas refer to the different chemical milieus identified by the microelectrode measurements in Fig. 1A.

