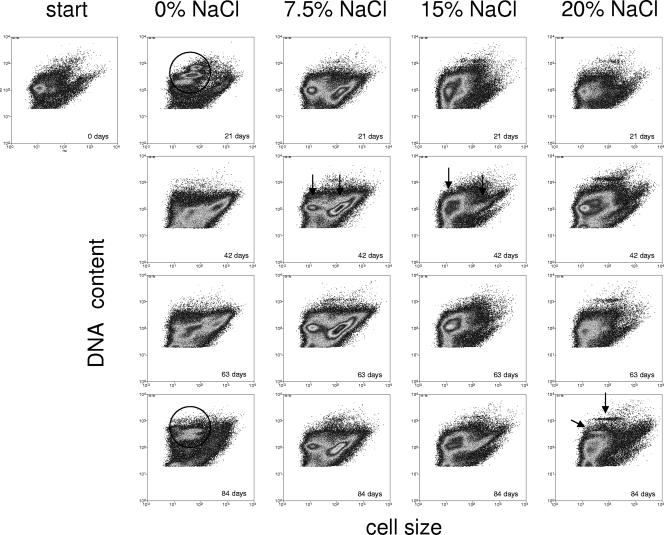
FIG. 3.
Community dynamics during growth at different NaCl concentrations over a time range of 84 days. The population patterns were obtained by determination of bacterial DNA content and cell size. All incubations were started with the same inoculum. Cell cycle-related (circles) and salinity-related (arrows) subpopulations are highlighted; see Results for details.

