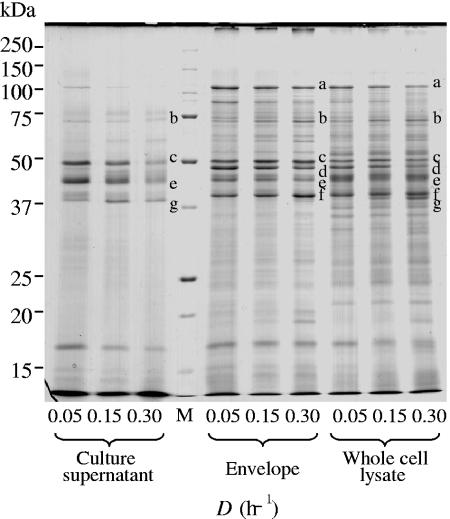
FIG. 1.
Comparison of SDS-PAGE patterns at various growth rates. Cells were grown in sTSB. Dilution rates were set at 0.05, 0.15, and 0.30 h−1. Samples for the culture supernatant fraction were prepared from the same volume of culture and loaded on the basis of the same volume. The same amount of protein (50 μg) was applied for the envelope and whole-cell lysate fractions. The gel was stained with CBB. Protein bands of major virulence factors are shown as follows: a, RagA; b, 75-kDa protein; c, Kgp; d, RagB, e, Rgps; f, OmpA-like proteins; g, FimA. Lane M, molecular mass marker.

