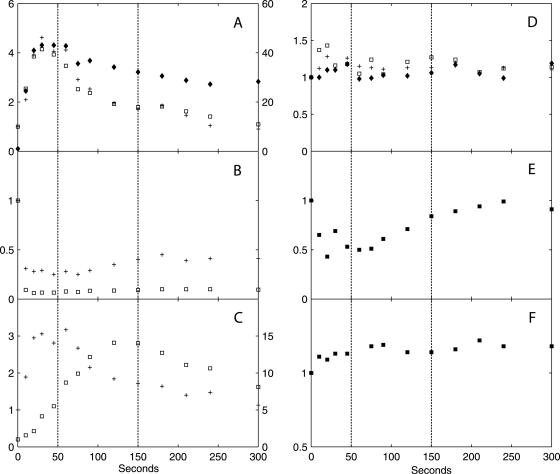
FIG. 4.
Dynamic responses of intermediates in glycolysis, the PP pathway, and storage carbon metabolism and thence-derived biosynthetic precursors, in x-fold changes relative to the reference steady state. (A) G6P (□, left axis), F6P (+, left axis), and F1,6bP (⧫, right axis); (B) 2PG + 3PG (+) and PEP (□); (C) G1P (+, left axis) and T6P (□, right axis); (D) His (+), Phe (□), and Tyr (⧫); (E) 6PG; (F) trehalose. The relative standard deviation of metabolite concentrations at each time point is within 10%, based on duplicate determinations. The vertical dotted lines indicate the three metabolic phases.

