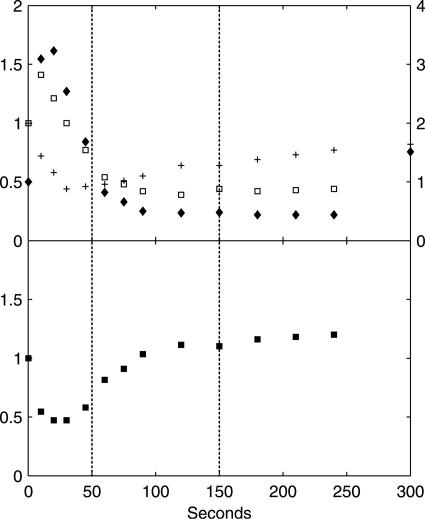
FIG. 6.
(Upper panel) Dynamic responses of ATP (+, left axis), ADP (□, left axis), and AMP (⧫, right axis), in x-fold changes relative to the reference steady state. (Lower panel) Change in energy charge relative to the steady state. The energy charge in the steady state is 0.86, as calculated from the steady-state ATP, ADP, and AMP concentrations in Table 2. The relative standard deviation of metabolite concentrations at each time point is within 10%, based on duplicate determinations. The vertical dotted lines indicate the three metabolic phases.

