FIG. 7.
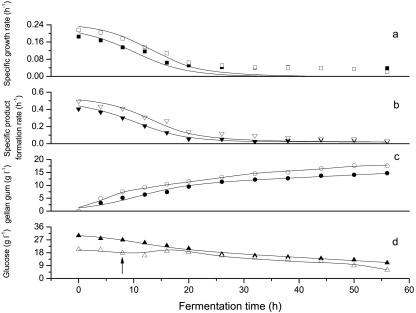
Comparison of specific growth rates (a), specific product formation rates (b), gellan gum yields (c), and concentrations of glucose (d) between batch fermentation and fed-batch fermentation. The lines represent model predictions. Scattered solid symbols, representing specific growth rate (▪), specific product formation rate (▾), gellan gum production (•), and glucose concentration (▴), are for batch fermentation, and scattered open symbols, representing specific growth rate (□), specific product formation rate (▿), gellan gum production (○), and glucose concentration (▵), are for fed-batch fermentation. The arrow indicates the starting time of feeding.

