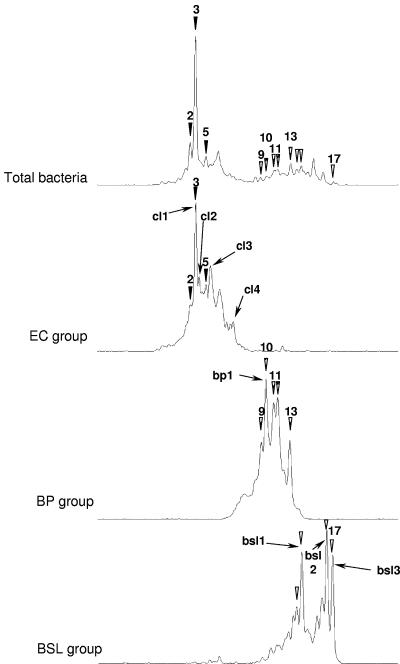
FIG. 3.
Comparison of the bacterial SSCP profile with profiles obtained after nested PCR-SSCP targeting the Clostridiaceae (EC group), the BP group, and the BSL group. Amplification was performed with storage tank pig slurry samples obtained on day 21. The peak numbers are the same as the numbers in Fig. 1 and 2. Peaks that comigrated in the bacterial profile and group profiles are indicated by solid arrowheads for the EC group, by striped arrowheads for the BP group, and by open arrowheads for the BSL group. Peaks that could be identified are designated cl1 to cl4, bp1, and bsl1 to bsl3, as shown in Table 3.

