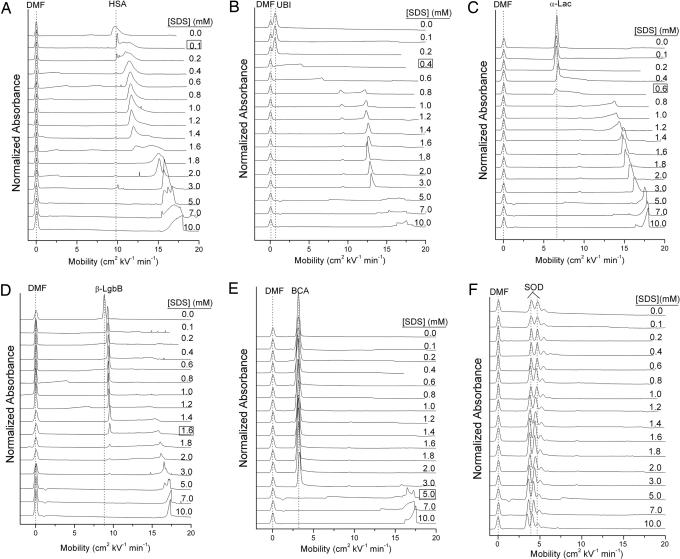
Fig. 1.
Electropherograms showing the denaturation of six representative proteins. (A) Albumin from human serum. (B) Ubiquitin. (C) α-Lactalbumin. (D) β-LgbB. (E) BCA. (F) SOD. The concentration of SDS in the buffer is labeled on each electropherogram, and the concentration of SDS at which the protein denatures on the capillary is boxed and listed in Table 1. These electropherograms were measured in Tris-Gly buffer (25 mM Tris/192 mM glycine, pH 8.4) at 15°C.

