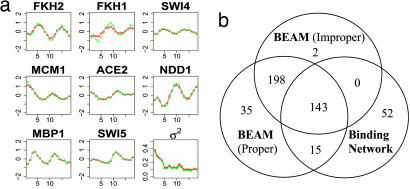
Fig. 1.
Sensitivity to prior specification. (a) The posterior mean profiles of relative TF activities or σt2 versus 18 time points based on either improper (red triangle line) or proper (green cross line) prior distributions. (b) Venn diagram showing the overlaps of the inferred regulatory targets based on BEAM using improper and proper priors and those with the observed protein–DNA binding data.

