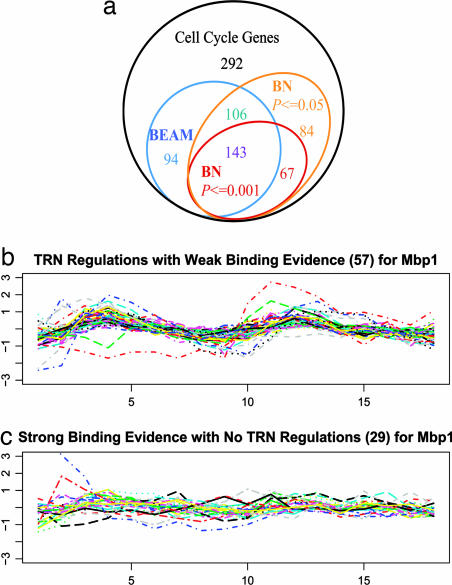
Fig. 4.
Comparisons between the inferred TRN from BEAM and the observed protein–DNA binding data. (a) Venn diagram for comparisons. All cell-cycle genes (786 total) are in the black circle. The inferred regulated genes based on BEAM (343 genes) are in the sky-blue circle, the inferred regulated genes based on the observed BN with a P ≤ 0.001 cut-off (210 genes) are in the red circle, and the inferred regulated genes based on the observed BN with a P ≤ 0.05 cut-off (400 genes) are in the orange circle. (b and c) Focus on Mbp1, gene expression profiles versus 18 time points are plotted for 57 genes that were inferred to be regulatory targets by BEAM but had weak binding evidence (b) and 29 genes with strong binding evidence but were not inferred to be regulated by Mbp1 (c).

