Fig. 6.
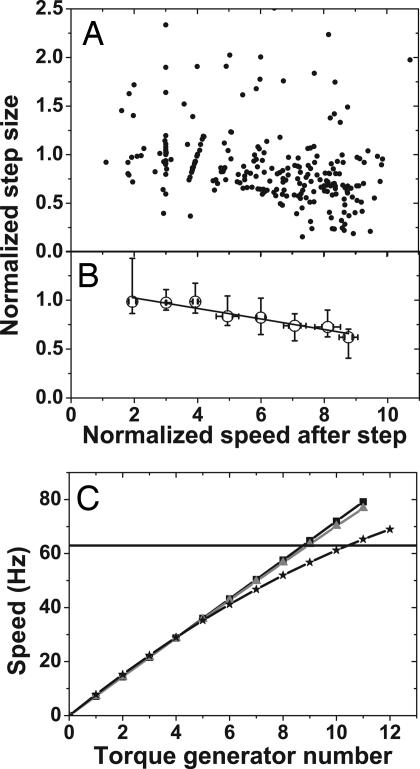
Step size during resurrection experiments. (A) Normalized step size vs. normalized speed. Only upwards steps are shown. (B) Median and interquartile range for the data in A, binned according to speed after the step, illustrating the decreasing trend. A linear fit to the median values is shown. (C) Models for speed vs. torque-generating unit number. Squares, each unit contributes 7.2 Hz; triangles, the average unit torque decreases according to the measured torque-speed curve (15); stars, step size depends on speed according to the linear fit in B. The horizontal line at 63 Hz marks the average speed of fully induced cells.

