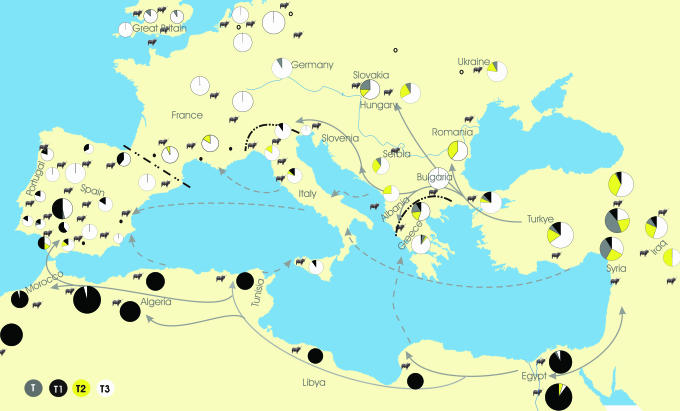
Fig. 2.
European spread of agropastoralism. Each black cattle figure represents a population sample point. Different hypothesized maritime routes (dashed line with arrow) and continental route (solid line with arrow) are indicated. Dash-dot lines are suggestive of the geographic limits of African cattle influence in Europe. Pie chart represents the frequencies of the four major mtDNA haplogroups, with circle sizes proportional to sample sizes. The figure is adapted from ref. 33.

