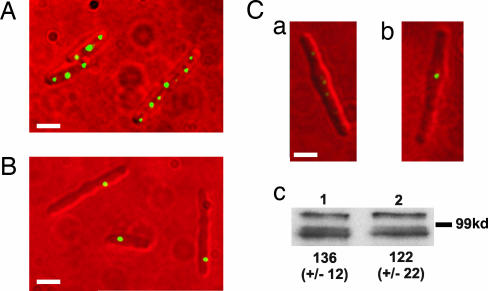
Fig. 5.
Fluorescence images of the cytoplasmic cluster position in filamentous cells. (A) Wild-type background. (B) ΔppfA. (C) Images have been treated in an identical manner and clearly show that the single cluster present in the ΔppfA strain (Cb) is brighter than any of the six clusters present in the wild-type background (only five clusters are visible in Ca, but six are observed with longer exposure times; data not shown). (Scale bars: 2 μm.) (Cc) Western blot analysis using anti-GFP antibody to crossreact with TlpT-YFP in filamentous cells containing (Cc1) and deleted for (Cc2) ppfA. Values represent the mean band intensity from six independent experiments (arbitrary units). The same samples were also probed with an antibody to CheA2, a component of the polar chemotaxis protein cluster whose level remained constant in both strains (data not shown).

