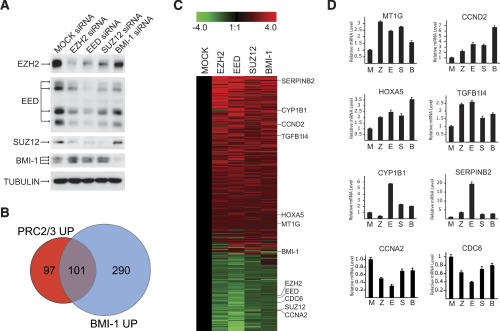
Figure 1.
Genome-wide expression screen to identify gene changes in Polycomb depleted cells. (A) Western blot analysis of lysates prepared from TIG3 fibroblasts 44 h after transfection with siRNA oligos designed to inhibit the expression of EZH2, EED, SUZ12, or BMI-1. Tubulin was used as a loading control. (B) Venn diagram depicting the overlap in genes increased >1.2-fold in PRC2 (EZH2, EED, and SUZ12 combined) and PRC1 (BMI-1) depletion. (C) Treeview representation of Affymetrix expression data depicting the gene expression changes in Polycomb-depleted cells. (D) Validation of gene expression changes by qPCR for a selection of genes (indicated in B). mRNA was prepared from TIG3 cells transfected with Mock (M), EZH2 (Z), EED (E), SUZ12 (S), or BMI-1 (B) siRNAs. The experiments were performed independently of the gene expression array experiments.

