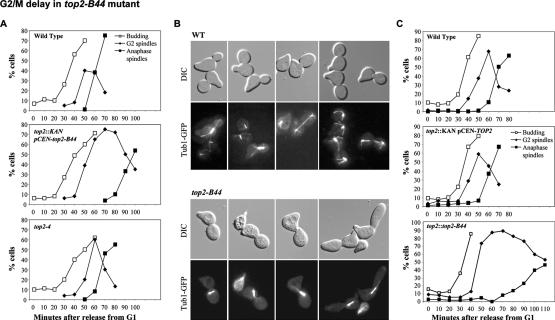
Figure 1.
top2-B44 mutant cells delay in G2/M. Cell cycle analysis of wild-type versus top2 mutants at 32°C, released from mating pheromone-induced G1 synchrony. Samples were processed for FACScan analysis of DNA content (not shown) and cytology (budding and spindle morphology was scored). (A) Cell cycle progression after release from G1 in wild-type versus top2∷KAN pCEN-top2-B44 and top2-4. (B) Photomicrographs showing G2/M delay in top2∷KAN pCEN-top2-B44 cells; wild-type cells with large buds (top; photos taken 70 min after release from G1) have elongated or disassembled spindles, while top2-B44 cells with large buds often contain short G2 spindles (photos taken 80 or 90 min after release from G1). (C) Cell cycle progression after release from G1 in wild-type versus a top2-null strain containing pCEN-TOP2(TRP1) (top two graphs) and in top2∷top2-B44 cells (bottom graph).

