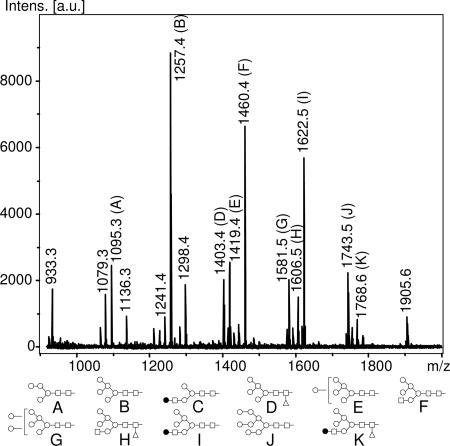
Fig. 2.
MALDI-TOF spectra of [M+Na+] ions from m/z of 900–2,000 from xylGalT12 N-glycans. Diagrams indicating the proposed structures of peaks representing >4% of total peak area or mentioned in the text have been added below the spectrum, and ions representing >1.5% of total peak area have been denoted with their corresponding m/z value.

