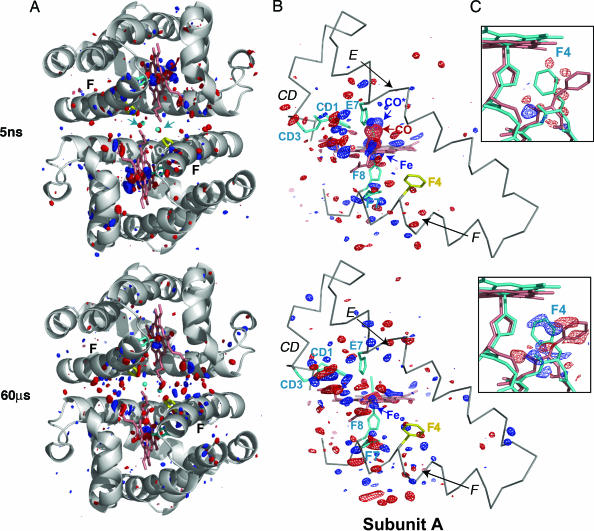
Fig. 1.
Difference Fourier map HbI* (photoproduct) minus HbI-CO at time delays of 5 ns and 60 μs is shown for the entire dimer (A); CD, E, F, and heme regions of subunit A (B); and the Phe F4 of subunit A (C). Fig. 5, which is published as supporting information on the PNAS web site, provides equivalent views for subunit B [the figure was produced with pymol (38)]. (A) A ribbon diagram of the HbI-CO dimer (gray) with side chains for His F8 (cyan), Phe F4 (yellow), and key interface water molecules (small cyan spheres) are shown along with the difference Fourier map. The maps are contoured at ±3.5σ (blue and red, respectively) for both A and B. Note the concentration of difference density mainly in the immediate heme region and along the F helix at 5 ns. The density distributes toward the interface by 60 μs. Arrows (in cyan) point out the position of two key R-state water molecules in the 5-ns map that show clear negative density as they rapidly respond to the loss of ligand. Removal of these two water molecules is required for the subsequent movement of the heme groups toward the subunit interface. (B) An α-carbon trace (gray) for the CD region and E and F helices along with the heme group (salmon), side chains for CD1, CD3, E7, F7, and F8, (cyan) and F4 (yellow) are shown. The photolysis signal at the bound CO position (labeled CO) is highly significant at 5 ns: −14σ and −17σ for the A and B subunits, respectively. The strong positive feature indicating the iron displacement (labeled Fe) is at +12σ and +14σ, for the A and B subunits, respectively. Note the extensive structural rearrangement involving the heme group at 5 ns, along with that of the CD region and F helix. (C) Difference electron density is shown for the region around F4 Phe at ±2.5σ in blue and red, respectively, along with the atomic model for the liganded (salmon) and unliganded (cyan) structures. Phe F4 undergoes the largest ligand-linked side-chain rearrangement during the R-to-T transition. As the density maps show, this movement has not occurred at 5 ns but is completed by 60 μs after the ligand release.

