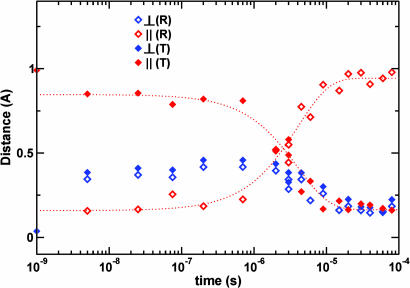
Fig. 3.
Time-dependent change in the heme iron position. This shift is broken down into components that are perpendicular to the heme plane (blue symbols) and components that are parallel to the heme plane (red symbols). The change is measured as the difference in position relative to the starting R-state position (open diamonds) and ending T-state position (filled diamonds). Flash photolysis causes the heme iron to move 0.4 Å perpendicular to the heme plane while shifting by only 0.15 Å parallel to the plane, away from its starting R-state position and toward the T-state position. The heme iron stays in this vicinity during the nanosecond time domain and moves toward its ending T-state position in the microsecond time domain, synchronously with other structural changes involved in the allosteric transition shown in Fig. 2.

