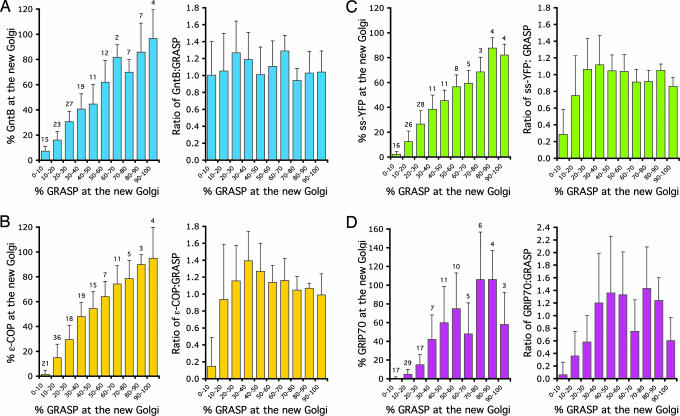
Fig. 3.
Quantitation of markers at the new Golgi. Cells stably expressing GntB-YFP (A), YFP-ε-COP (B), ss-YFP (C), and YFP-GRIP70 (D) were fixed and labeled with anti-GRASP antibodies as in Fig. 2, and the levels of YFP and GRASP fluorescence were quantitated and expressed as the percentage in the new Golgi relative to the old. (Left) Plots of the percentage of YFP-tagged protein against the percentage of GRASP, with the latter data points binned for every 10% of GRASP at the new Golgi. (Right) Plots of the ratio of YFP-tagged protein to GRASP against the binned data for GRASP. Each panel was constructed from three experiments and a total of 127 (A), 139 (B), 115 (C), and 109 (D) experimental points. Note that GntB and GRASP are present in similar amounts at the new Golgi at all sizes, and the ratio remains relatively constant at ≈1. In contrast, YFP-ε-COP, ss-YFP, and YFP-GRIP70 were mostly absent from the new Golgi containing up to 10% GRASP, and the ratio was <0.3, arguing that these are later arrivals. Results were expressed as the mean ± SEM. The number of experimental points for each binned data set is indicated above the error bars.

