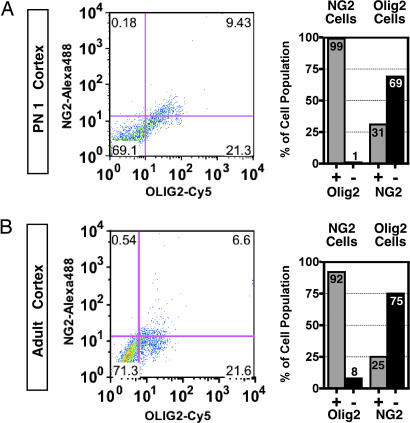
Fig. 2.
Flow cytometry characterization of NG2 and Olig2 cell populations in postnatal mouse brain. (A) Flow analysis of full thickness dorsal cortical mantle from postnatal day 1 (PN1) mouse for NG2 (rabbit polyclonal; Chemicon) and Olig2 (mouse monoclonal, TV37–1C10) (n = 2 animals). (B) Flow analysis of adult mouse dorsal neocortex for NG2 (rabbit polyclonal; Chemicon) and Olig2 (mouse monoclonal TV37–1C10) (n = 2 animals). Note that, at both stages, >90% of NG2 cells are Olig2+. Conversely, NG2 cells represent <31% of the total Olig2+ cell population.

