
Figure 1.
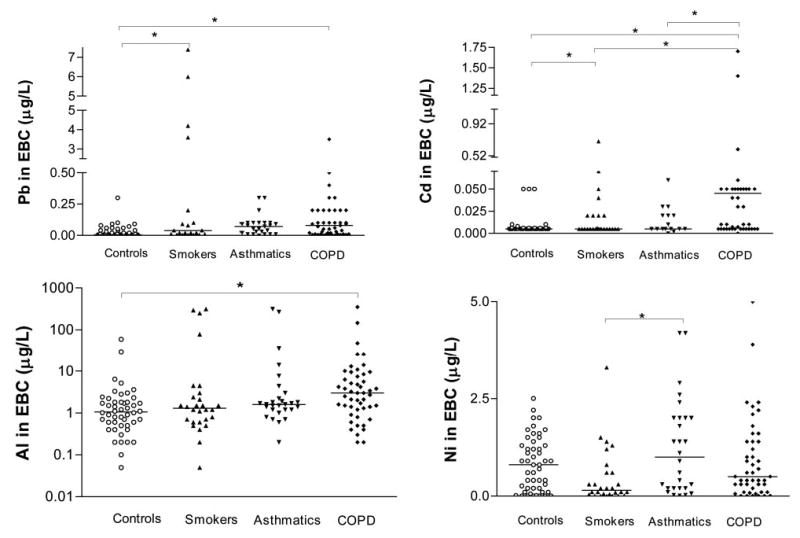
Lead, cadmium, aluminum (expressed in log10 scale), and nickel levels in the EBC of the studied groups. Between-group differences were sought using the Kruskal-Wallis test (p < 0.0001), followed by Dunn multiple comparison test (*p < 0.05). The horizontal lines represent median values.