

Abstract
Objective: To describe 3 measures of incidence used in sports injury epidemiology.
Background: To promote safety in sports, athletic trainers must be able to accurately interpret and apply injury data and statistics. Doing so allows them to more efficiently articulate this information to school administrators in recommending increases in medical resources, such as more personnel, better services, and safer facilities and equipment.
Description: Using data from a study of high school sports injuries, we review incidence rates, epidemiologic incidence proportions, and clinical incidence. The incidence rate is the number of injuries divided by the number of athlete-exposures and is based on the epidemiologic concept of person-time at risk. It accounts for variation in exposure between athletes and teams and is widely used by researchers. The epidemiologic incidence proportion is the number of injured athletes divided by the number of athletes at risk. It is a valid estimator of average injury risk, yet it is rarely used in sports injury epidemiology to communicate information about such risks to nonscientists. Clinical incidence is a hybrid between the epidemiologic incidence proportion and the incidence rate in that it uses the number of injuries in the numerator but the number of athletes at risk in the denominator. It has been widely used in research on high school football injury but is neither a valid estimator of risk nor a true rate.
Advantages: Athletic trainers who understand the causes of and risk factors for sport-related injury are better positioned to make safe return-to-play decisions and decrease the likelihood of reinjury in athletes.
Keywords: injury epidemiology, injury prevention
The distinction and interpretation of sports injury statistics are relevant to the role of athletic trainers, who are responsible, in part, for promoting the safety of sport in society. It is therefore important for athletic trainers in all settings to gain an understanding of the causes of and risk factors for sport-related injury. To do this, athletic trainers must be able to accurately interpret and apply injury data and statistics to more efficiently articulate this information to school administrators in recommending increases in medical resources, such as more personnel, better services, and safer facilities and equipment. Ultimately, athletic trainers who understand these concepts will be better positioned to make safe return-to-play decisions and decrease the likelihood of reinjury in athletes.
At least 3 target audiences exist for these 3 different measures of incidence: the athlete, the research scientist, and the clinician. Understandably, the athlete (or his or her parents) is most interested in the answer to the question, “What is the risk of injury if I play a specific sport (eg, high school football) this season?” Athletes with a history of injury during the season may be more interested in the probability of a subsequent injury if they continue to play. The epidemiologic incidence proportion (IP) (the number of injured athletes divided by the number of athletes at risk), as a measure of average risk, is well suited to this type of question. From a scientific perspective and for epidemiologists in particular, questions such as “What is the incidence of injury per unit of exposure (eg, games, practices, hours, or minutes)?” may require the use of rates rather than risks to accommodate the different lengths of playing seasons for various sports, amount of exposure to sport, and lengths of follow-up among athletes. Finally, clinicians may approach sports injuries from a resource-utilization standpoint (eg, how many injuries they expect to treat in a season). Clinical incidence can be used to address this type of question.
BASIC MEASURES OF INJURY INCIDENCE
Incidence refers to the number of new occurrences of disease during a specified period of time. 1 Risks and rates are 2 distinct ways of measuring the incidence of sports injury, but many people incorrectly assume that rates and risks are essentially one and the same. This commentary reviews 3 measures of incidence—epidemiologic IP, incidence rate (IR), and clinical incidence—and addresses their interpretation in sports injury studies. The epidemiologic IP is interpreted as the average risk of injury per athlete and the IR is the incidence of injury per unit of athlete time, whereas the clinical incidence is more appropriate as a measure of resource utilization.
Example: North Carolina High School Athletic Injury Study
We use data from the North Carolina High School Athletic Injury Study (NCHSAIS) to provide examples of conceptual links and differences among these various incidence measures. The NCHSAIS prospectively collected injury data from 1996 to 1999 from varsity athletes in 12 sports in 100 public high schools. 2 Specific results of this study have been published. 3–5 In this study, we describe the injury experience of 2 high school teams—a football team and a volleyball team—during the course of 1 season and show how to compute risks and rates. We chose these teams for illustrative purposes only.
BASIC EPIDEMIOLOGY: INCIDENCE VERSUS PREVALENCE
In sports injury research, it is important to distinguish between incidence and prevalence ( Table 1). In epidemiology, prevalence refers to the proportion of individuals in a population who have a disease at a particular time, whereas incidence refers to the number of new occurrences of disease during a specified period of time. 1 As applied to sports injury epidemiology, the prevalence of injury is the proportion of athletes who have an existing injury at any given point in time, whereas injury incidence is the number of new injuries that occur over a specific period of time, such as from the start of the season. Consequently, our focus is issues related to estimating injury incidence, rather than prevalence, in sports injury research.
Table 1. Definitions of Epidemiologic Terms Commonly Used in Sports Injury Research.

INTRODUCTION TO RISKS AND RATES
The word risk is often used very loosely in sports injury epidemiology, and many scientists incorrectly refer to rates as if they were risks (and vice versa). For example, it would not be unusual to hear a statement such as, “The fact that the injury rate is higher in football than in volleyball means that there is a greater risk of injury in football.” However, a more precise definition of risk is the average probability of injury per athlete, an interpretation that is in line with modern epidemiologic concepts. 1
To illustrate the differences between risks and rates, consider the numerator and denominator values for each type of measure. The numerator of the risk is the number of injured athletes, whereas the numerator of the rate is the number of injuries. The number of injuries is greater than the number of injured athletes when 1 or more athletes sustain repeat or multiple injuries during the season. The denominator of the risk is the number of athletes at risk, whereas the denominator of the rate is the total amount of time the athletes are at risk.
The IP directly measures the average risk of injury as the number of injured athletes divided by the total number of athletes at risk during a specified time period (ie, a team during 1 season). This quantity plays an important role in sports injury epidemiology because it directly estimates the injury risk. The IR, defined as the number of injuries divided by the total person-time at risk (eg, athlete-exposures) is not a direct measure of injury risk because it is a rate, not a risk; however, as we discuss later, it has many important advantages for specific sports injury research. A third measure, which we have named clinical incidence for the purpose of this study, has not been formally defined in the epidemiologic literature, though it has been widely used in sports medicine research. Clinical incidence is a hybrid measure of incidence that represents the average number of injuries per athlete. It uses the number of injuries (rate numerator) in its numerator but the number of athletes at risk (risk denominator) in its denominator. Clinical incidence is neither a risk nor a rate, although it may serve as an indicator of clinical or resource utilization. Because of the lack of a consistent standard in the literature, it is important to distinguish among the different interpretations of each measure.
If each injured athlete sustains only 1 injury during the season, the epidemiologic IP and the clinical incidence measure are the same (ie, numerically equivalent). However, the epidemiologic IP and clinical incidence differ if some athletes sustain more than 1 injury during the season. In this situation (multiple injuries per athlete), the clinical incidence has no meaningful interpretation as a measure of average risk. The epidemiologic IP, on the other hand, always has a meaningful interpretation in terms of average risk. 1 However, the epidemiologic IP is rarely used in the sports injury literature because is it hard to compare different sports by using IP. The IR is generally used instead. Nevertheless, IP is a useful means of communicating information about average risk to the general public.
Counting sports injury events and exposure opportunities may seem simple, yet unique methodologic challenges occur in estimating injury incidence. For example, it is possible for athletes to sustain recurrent injuries to the same or different body sites (eg, repeated concussions or anterior cruciate ligament injury to both knees). This issue of recurrent outcomes is also present in research areas such as cardiovascular disease epidemiology and cancer epidemiology, in which diseases can and do recur over time. In chronic disease epidemiology, it is typical for incidence studies to focus on the initial onset of disease (eg, onset of high blood pressure or primary tumor). This is a less reasonable approach in sports injury epidemiology because injuries heal and athletes recover; thus, “secondary” injuries on the same athlete often may represent etiologically distinct events, as well as correlated events, which may be due to issues such as risk-taking behaviors or the presence of nonmodifiable risk factors. In addition, multiple injuries may occur during the same injury event (eg, sprained ankle and fractured toe). In that case, it is unclear which injured body part would be considered the incident injury.
CONFIDENCE INTERVALS, P VALUES, AND SAMPLE SIZE
Measures of incidence in sports injury epidemiology should always be accompanied by confidence intervals (CIs). The standard interpretation of the 95% CI is as follows: If a given study were hypothetically repeated 100 times and 100 CIs were computed from those studies, 95 of the 100 CIs would contain the true incidence in the population. Confidence intervals are related to study size. A small study generally has wide CIs, indicating a less precise study, whereas a larger study has narrower CIs (better precision). Of course, the underlying variability of the rate also affects the CI.
Confidence intervals are closely related to P values. For example, suppose a researcher wanted to test whether the injury rate was different in 2 sports. This could be done by using a P value or, equivalently, by comparing the 95% CIs for the rates. If the 95% CIs do not overlap, then (in general) the P value for testing whether the rates are different will be statistically significant at the 5% level.
Confidence intervals are more useful than P values because they contain more information than do P values alone. A P value is just one number, whereas a CI is a range. Put another way, CIs separate the size of the study (the width of the interval) from the size of the effect (the rate), whereas P values combine the study size and the study effect into 1 overall measure.
Small Sample Size
Some sports injury studies are based on small numbers (eg, a small number of athletes on one team or a small number of teams within an organization). Overinterpreting the results of analyses based on small study size is a danger. Wide CIs may indicate incidence measurements that are unstable because of small numbers. As an illustration of this, notice how much wider the CIs in example 2 (below) are than the CIs in example 1 because of the greater number of athletes and injuries.
In cases where the subgroup size (ie, the numerator of the IP, clinical incidence, or IR) is less than 5, “exact” CIs are preferred to the formulae given below. Describing the calculation of exact CIs is beyond the scope of this study but is discussed in statistics texts. 6 Exact statistics are available in most statistical software packages such as SPSS (SPSS Inc, Chicago, IL), Stata (Stata Corp, College Station, TX), or SAS (SAS Inc, Cary, NC). However, the problem of wide CIs because of small numbers and the danger of overinterpretation of the data exist regardless of whether the CIs are computed by the formulae below or by exact methods.
APPLICATION OF CONCEPTS
Epidemiologic Incidence Proportion: First Injury
For sports injuries, the epidemiologic IP has an interpretation as the average probability, across all athletes, that an athlete will be injured during a season (or seasons) of participation. Essentially, the numerator of the IP is a subset of the denominator, so the resulting proportion has a lower bound of 0 and an upper bound of 1, inclusively. Thus, for sports injuries, the estimated epidemiologic IP would be as follows 1:
 |
where the number of injured athletes is defined as the number of athletes who sustain at least 1 injury. Thus, if only 1 athlete on the team is injured during a season but he or she sustains 5 injuries, the numerator of the IP is 1, not 5. (In this situation, the numerator of the IR is 5; see below.)
The formulae for calculating the SE and 95% CI for IP are as follows 7: Estimated SE for the epidemiologic IP is:
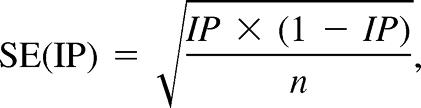 |
where n is the number of athletes at risk of injury at the start of the season
However, it is important to note the implicit time period of interest, typically 1 season, and that athletes are assumed to have complete follow-up in terms of injury occurrence and recovery. If follow-up is not complete, the epidemiologic IP will underestimate the average risk of injury in the population. We stress that the time period over which the epidemiologic IP is defined (eg, 1 season, 5 seasons, or 1 week) should always be reported; this measure has no logical interpretation unless the duration of the follow-up period is specified. The events in the numerator can be considered to be generally statistically independent because the events involve injured athletes, not injuries, and this means that the simple formula for the SE, as above, can be used.
Example 1
The first example with NCHSAIS data involves the injury experience of 1 high school football team during 1 season. A team with 36 athletes experienced 44 injuries among 22 athletes during a single season ( Figure 1). Therefore, the epidemiologic IP for 1 season is 0.611 (22 injured athletes/36 athletes at risk at the start of the season). Thus, the average probability that any athlete on this team will sustain at least 1 injury during the course of 1 season is 61.1% (95% CI: 45.2%, 77.0%). The epidemiologic IP is a valid estimate of average risk and is the most appropriate way to address the question, “What is the average risk of injury to a football player on this team during a season?” The answer is that 61.1% of football players were injured during the season. Specific risk factors may, of course, increase or decrease a specific individual's risk of injury, but the average risk of injury for athletes on this team for 1 season was 61.1%.
Figure 1. Incidence of injury on 1 high school football team during 1 season. *Athlete-exposure is defined as 1 athlete participating in 1 game or practice.

Epidemiologic Incidence Proportion: Risk of Repeat Injury
The average probability of sustaining at least 1 injury does not provide the complete picture of the athlete's risk of injury throughout the course of a season because it combines players with single as well as multiple injuries. For example, of the 22 injured athletes, 10 sustained more than 1 injury, with 1 athlete having 6 separate injuries during that season ( Figure 1, Table 2). Multiple injuries are common in high school football, which leads to a follow-up question for athletes: “Given that I've had 1 injury this season, what's the probability that I'll have another injury?” In this example, the probability of subsequent injury during 1 season is 45.4% (95% CI: 25.0%, 66.3%). It is important to note the numerator from the epidemiologic IP for at “least 1 injury” is now the denominator for the epidemiologic IP of “2 or more injuries” (10 athletes with more than 1 injury/22 injured athletes). To take the example an additional step, the probability for subsequent injury if the athlete has already had 2 injuries is 80.0% (95% CI: 55.2%, 100.0%; 8 athletes with more than 2 injuries/10 athletes with more than 1 injury). As the number of injuries per injured athlete increases, the denominator continues to decrease until all the players have been injured or the season ends and they are no longer at risk. The effect of this constantly decreasing denominator is that the CIs rapidly become wide, and, in practical terms, it is difficult to make meaningful conclusions about risks for third, fourth, fifth, and more injuries.
Table 2. Calculation of Incidence Measures for High School Football Team Described in Figure 1 .

An important conclusion from the analysis of repeat injury risks is that the risk of subsequent injury does not decrease to 0 and, in fact, may increase once an athlete is injured. The distinction between first injuries and subsequent injuries is pertinent to parents, athletic trainers, and other medical staff but is rarely, if ever, discussed in the sports injury literature. Consequently, the actual risk of injury for athletes has not been successfully communicated to practitioners because it is not a single number but rather a sequence of conditional probabilities.
Incidence Rate
In addition to the athlete's perspective of risk, the time spent at risk is also important to consider, particularly from a research perspective. This focus may be to address questions such as, “What is the rate of injury per unit of exposure?” where the unit of analysis is the number of injuries, not the number of injured athletes. The IR is the preferred estimator of occurrence in this case, accounting for variations in time at risk among athletes. Time at risk may be defined in terms of athlete-seasons (1 athlete participating for 1 season), athlete-games (1 athlete participating in 1 game), athlete-practices (1 athlete participating in 1 practice), athlete-exposures (1 athlete participating in 1 game or practice), or athlete-minutes or athlete-hours. In general, exposure time information should be collected as precisely as possible (eg, minutes or hours), and some authors have attempted to quantify the minutes or hours of sport participation for individual athletes. Because this is very difficult to do, more often the number of competitions and practices per individual athlete is used. In that case, the general term athlete-exposure is often used. The use of athlete exposures is an application of the general epidemiologic concept of person-time at risk that is specific to sports injury epidemiology. For convenience, we use the term person-time below, but this will be athlete-exposures in our example data.
For epidemiologic purposes, an IR is estimated as follows 1:
 |
An IR has a lower bound of 0 and an upper bound of infinity. It is expressed in units that are the inverse of person-time. Specifically, “a person-time rate expresses the increase in the incidence number [of events] we expect per unit increase in person-time.” 1 Repeat injuries in the same athlete violate standard assumptions of statistical independence. When an event or disease can recur, an IR is often specified as the rate of first occurrence. Thus, as soon as a population member has experienced the first event, it is counted in the numerator, and he or she stops contributing time to the denominator until eligible again for another event (ie, when the athlete returns to play). To account for the fact that some of the injuries are correlated within athletes, a clustered variance estimator may be needed. 8 9 If the number of multiple injuries per injured athlete is low, these formulae for calculating the estimated SE and 95% CI can be used 7:
 |
However, a complexity of sports injury research is the possibility that multiple injuries may occur to the same person at the same time. For example, an athlete can sustain a concussion and facial laceration in 1 injury event, whereas a person cannot have 2 colds at once. In that case, 2 or more eligible numerator counts for the first occurrence of injury may exist. It is unclear how to account for this factor when estimating IRs, though authors tend to estimate either rates of any occurrence or rates of primary diagnoses (ie, concussion as primary diagnosis over facial laceration). This highlights the difference between rates of injury events and rates of injuries.
Consider example 1 again. For the football team, 36 athletes had a total of 3860 athlete-exposures during 1 season. In this study, an athlete-exposure was defined as participation in scheduled team practices or games during the course of the season. Therefore, an athlete-exposure represents any opportunity for an athlete to be injured. With 44 observed injuries, this translates to an estimated IR of 11.3 injuries per 1000 athlete-exposures (95% CI: 8.0, 14.8) for 1 season.
Clinical Incidence
Although the epidemiologic IP is a logical measure of the average injury risk, it is rarely seen in the sports injury literature. Instead, an alternative incidence measure, clinical incidence, has historically been widely reported. Table 3 shows the reported injury incidences from a select group of studies from the high school football injury literature over the past 30 years. The studies were identified through the PubMed database 10 with search strings including the phrase high school football injuries. The chosen studies are not inclusive of all studies of injuries in high school football but illustrate the various injury statistics that have been reported in the past. It is also important to note that the specific research questions and study design will affect the type of data collected and, therefore, which incidence measures can be estimated. However, it is equally important to appropriately interpret the measures that are ultimately reported and even more important to design studies that comprehensively address the different ways of computing incidence.
Table 3. Examples of Reported Risk Estimates in the High School Football Sports Injury Literature, 1974–2003.

In contrast to the epidemiologic IP, the clinical incidence defines the numerator as the number of injuries, not the number of injured athletes, yet still uses the number of athletes at risk in the denominator:
 |
This conceptual mismatch between the numerator (injuries) and the denominator (athletes) results in a measure that has no meaningful interpretation as an estimate of average risk. One athlete can sustain multiple injuries during the course of a season (as seen in example 1) and for each injury event. Thus, the clinical incidence can be greater than 1. Although it may be useful in addressing the expected burden on clinical resources, which may account for its historical appeal, it does not truly represent average risk. Unfortunately, many authors have used clinical incidence as a surrogate measure of average risk. 11 Other authors refer to the clinical incidence as a “rate.” 12–22 This is also incorrect because it does not use a person-time measure, such as athlete-exposures, in the denominator.
Clinical incidence does not address the question, “What is the probability that an athlete will be injured this season?” Rather, it addresses the question, “What is the expected frequency of injury, given a certain number of athletes?” The distinction is subtle. An epidemiologic IP approximates average risk, whereas clinical incidence addresses resource utilization. This distinction is meaningful because clinical incidence may be an important measure for athletic trainers interested in clinical resources.
In example 1, the clinical incidence is 1.22 (44 injuries/36 players), or 122% for 1 season, whereas the average risk (epidemiologic IP) is 61%. Clearly, risk cannot exceed 100% because an athlete cannot have greater than a 100% probability of injury during any specific time period. Another issue is that computation of a CI for the clinical incidence is complicated and should account for the fact that multiple injuries may be clustered in the same athlete, violating statistical assumptions of independence, but the formulae given below for the IR will be a reasonable approximation when the average number of injuries per athlete is low (typically fewer than 1.2 injuries per athlete).
Example 2
In some cases (ie, no multiple injuries), clinical incidence is numerically close or even equivalent to the epidemiologic IP, though the values do not have the same interpretation. Example 2 shows the observed injuries for 1 high school volleyball team during 1 season ( Figure 2, Table 4). Because there were no multiple injuries (5 athletes sustained 5 injuries, 1 injury per injured athlete), the estimated epidemiologic IP of 29.4% (95% CI: 7.8%, 51.1%) is equivalent to the estimated clinical incidence. In this example, the number of injuries in the numerator also happens to be the number of injured athletes. The interpretations of the values, however, are still different. The epidemiologic IP tells us that the probability of injury for the average high school volleyball athlete during 1 season is 29.4%, whereas the clinical incidence tells us to expect an average of 0.294 injuries per high school volleyball athlete. Again, the distinction is subtle, but the fact that both work out to be 0.294 does not result in the same interpretation.
Figure 2. Incidence of injury on 1 high school volleyball team during 1 season. *Athlete-exposure is defined as 1 athlete participating in 1 game or practice.

Table 4. Calculation of Incidence Measures for High School Volleyball Team Described in Figure 2 .

In terms of the IR, the volleyball team's 17 members accrued 741 athlete-exposures (scheduled team practices or games) during the course of 1 season. With 5 observed injuries, the estimated IR was 6.8 injuries per 1000 athlete-exposures (95% CI: 0.83, 12.7). Note the wide CI because the values are based on only 1 season of data from 1 football team and 1 volleyball team. Regardless, the rate (but not the risk) of injury in the football team is nearly twice the rate in the volleyball team.
If researchers limit themselves to measures of clinical incidence, they cannot effectively communicate to the public about the true risk of injury. Fortunately, during recent years, authors of the sports injury literature have tended to make less use of clinical incidence and more use of the IR when reporting data on injury incidence (for example, see Table 3).
Rate Ratios and Risk Ratios
To quantify how much higher the football rate is relative to volleyball, we can compute the rate ratio, which is simply the football rate divided by the volleyball rate, or 11.3/6.8 = 1.7. The formula for the CI for the rate ratio is more complex than the previous formula. It involves working with the natural log of the IR ratio (ln IRR) and the inverse of the natural log, exp (or e). The formulae are as follows 23:
 |
where # injuries A and # injuries B are the number of injuries in the numerator of each of the 2 rates (ie, the number of football injuries and the number of volleyball injuries). This gives an SE for the rate ratio of
 |
and a 95% CI of 0.7, 4.3.
The ratio of the 2 risks is another way to measure the increased incidence of injury in football relative to volleyball. The risk ratio comparing football with volleyball is 0.611/ 0.294 = 2.08. Calculating the CI for the risk ratio, like the CI for the rate ratio, involves using the natural log of the risk ratio (ln RR) and the inverse of the natural log, exp (or e). The formulae are as follows 23:
 |
which gives an SE for the risk ratio of (1/22 − 1/36 + 1/5 − 1/17) 1/2 = 0.4 and a 95% CI of 1.0, 5.0.
We can also take the difference, rather than the ratio, of the rates or risks. In that case, we would report the risk (or rate) difference. The advantage of the rate difference over the rate ratio is that it includes information about the scale of injury rate, which is lost when a ratio measure is computed. For example, if the injury rate were 2 per 1000 athlete-exposures in football and 1 per 1000 athlete-exposures in volleyball, the rate difference would be 1 per 1000 athlete-exposures (2 per 1000 minus 1 per 1000) and the rate ratio would be 2 (2 per 1000 divided by 1 per 1000). The rate difference retains the original scale of measurement for the rates (per 1000 athlete-exposures), whereas the rate ratio does not. On the other hand, if the injury rate were 2 per 100 000 athlete-exposures in football and 1 per 100 000 athlete-exposures in volleyball, the rate difference would be 1 per 100 000 athlete-exposures (2 per 100 000 minus 1 per 100 000), but the rate ratio would still be 2 (2 per 100 000 divided by 1 per 100 000). The rate ratio does not depend on the background incidence, just on the relative incidence of the 2 rates. The fact that incidence is much lower in the second situation is reflected in the rate difference but is not obvious from the rate ratio, which is 2 in both situations. Rate ratios are far more widely used in epidemiology than are rate differences.
Advantages of Rates Over Risks
In the example above, the rate ratio is lower than the risk ratio because the rate ratio accounts for the fact that the football team has more games and practices in a season than does the volleyball team. Thus, the benefit of the IR for the scientist is that the rates for the football and volleyball teams can be more directly compared because it incorporates information about variations in the time at risk between the teams. Moreover, within-sport comparisons are more meaningful because variations in the participation of individual athletes can also be accommodated. Furthermore, if rates were computed per athlete-minute, even finer variations (ie, length of volleyball game versus length of football game) could be controlled. The IR is particularly useful when comparing injury rates in specific situations, such as game rates versus practice rates and artificial surface rates versus grass surface rates and by player position.
However, when rates are compared among studies, they need to be measured on the same scale (athlete-hours, athlete-minutes, or athlete-exposures). Authors report incidence in many different ways; however, in many cases, the IRs based on athlete-hours can be converted to athlete-exposures. We encourage researchers to report their denominator data in detail (using a table) and to report the IRs using different denominators, as in a recent study of anterior cruciate ligament injury in the National Basketball Association (see Table 3). 24
Advantages of Risks Over Rates
From a layperson's perspective, the IP is more intuitive than the IR because it has an obvious interpretation as the average risk per athlete over a defined period (such as a season). Unlike the IR, the IP involves athletes, not athlete-time, in the denominator, so it can be understood without needing to comprehend the concept of person-time. Furthermore, information conveyed by the epidemiologic IP is more useful for risk assessment than information conveyed by the IR. Students and parents comparing the risks of participating in various sports should use IP, not IR. The athlete typically participates in the entire season (not just part of the season), so it makes sense to use IP, which does not adjust for differences in the number of games and practices among sports.
SHOULD WE REPORT RATES OR RISKS?
Researchers have the choice of making statements about injured athletes or number of injuries and, by extension, rates or risk. If the research questions pertain to injured athletes, an epidemiologic IP may be interpreted as the athlete's average risk of at least 1 injury. Whether that risk is subdivided into first and subsequent injuries will be driven by the research context. For example, it is extremely useful to know the probabilities of initial and subsequent injury in full-contact sports such as football and regarding commonly recurrent injuries such as concussions. However, if the research context deals with sports with few multiple or recurrent injuries, an epidemiologic IP for overall injured athletes may suffice. In short, if the unit of analysis is injured athletes, the epidemiologic IP is the best measure to approximate risk.
On the other hand, if the research questions pertain to the frequency of injuries per unit of exposure time, then an IR is the most helpful measure of incidence. The use of athlete-exposures is well established in sports injury research and facilitates comparing injury incidence in sports with variations in athlete-exposures or when time at risk within a single sport varies among athletes—distinctions not addressed by the epidemiologic IP.
The third measure, clinical incidence, uses the numerator of the IR but the denominator of the epidemiologic IP. It is therefore neither a rate nor a risk. Authors have frequently referred to it as a rate, possibly because proportions are often incorrectly labeled as rates (eg, case fatality rate and response rates are frequently used proportions whose names are misnomers). 25 Because this measure has no meaningful interpretation as an epidemiologic measure of incidence, we urge that its use be discontinued as a marker of average risk. In summary, the choice of which measure to report should be driven by the goals of the study.
NEED FOR STANDARDIZATION OF STUDY METHODS
Currently, it is very difficult to compare injury incidence estimates among published studies for 2 main reasons: (1) investigators have used very different methods for collecting injury data, different injury definitions, different ways of defining and collecting data on time at risk (exposure), and different ways of estimating incidence (see Table 1); and ( 2) authors do not report their methods in sufficient detail. The lack of detail in the Methods sections of sports injury papers is particularly frustrating because it denies readers the chance to interpret differences in reported incidence among studies as a function of differences in study methods. For example, in one report, the incidence in concussion in rugby union ranged from 0.1 per 100 player-seasons to nearly 10 per 100 player-seasons. 26 Differences of this magnitude (100-fold) cannot be attributed to underlying variations in the incidence of concussion among the various rugby-playing groups who formed the study populations but rather must be attributed in large part to differences in detecting concussions, counting time at risk, and computing measures of incidence. Researchers urgently need a checklist of items whose documentation should be required when they report sports injury data (eg, definition of injury, who collected the injury data and when it was collected, how time at risk was defined, and who collected time at risk data and when they were collected). If would be even more useful if researchers could agree on a core set of methods to be used in sports injury studies. 27
CONCLUSIONS
We all have a scientific responsibility to correctly report the incidence of specific sports injuries; however, it is equally important to interpret the chosen measure of incidence for the target audience. For community members and more laypeople who want to know about injury risk (eg, coaches, players, media, and parents), the epidemiologic IP is an appropriate measure. This can be easily explained as the average probability of injury. For research purposes, the IR is preferred because it is a more accurate representation of the rate of injury based on time at risk. We discourage researchers from reporting the number of injuries divided by the number of athletes at risk (clinical incidence) as if it were an IR, because this quantity is neither a rate nor a risk. Certified athletic trainers who have an understanding of both IP and IR will be better positioned to interpret injury surveillance statistics; communicate more effectively with physicians, parents, coaches, and athletes; and ultimately make safe return-to-play decisions.
Acknowledgments
This research was supported by grants from the National Institute of Arthritis, Musculoskeletal, and Skin Diseases (RO1AR42297) and the National Center for Injury Prevention and Control (R49/ CCR402444) to the University of North Carolina Injury Prevention Research Center. We also thank the following people for their review and comments on this study: Dr J. Michael Bowling, Dr Dana Loomis, Dr Robert Millikan, and Dr Frederick O. Mueller. We are especially grateful to Dr Charles Poole for his invaluable comments on the analysis of risks.
REFERENCES
- Rothman KJ, Greenland S. Measures of disease frequency. In: Rothman KJ, Greenland S, eds. Modern Epidemiology. 2nd ed. Philadelphia, PA: Lippincott Williams & Wilkins; 1998:29–46 .
- Weaver NL, Mueller FO, Kalsbeek WD, Bowling JM. The North Carolina high school athletic injury study: design and methodology. Med Sci Sports Exerc. 1999;31:176–182. doi: 10.1097/00005768-199901000-00027. [DOI] [PubMed] [Google Scholar]
- Schulz MR, Marshall SW, Yang J, Mueller FO, Weaver NL, Bowling JM. A prospective cohort study of injury incidence and risk factors in North Carolina high school competitive cheerleaders. Am J Sports Med. 2004;32:396–405. doi: 10.1177/0363546503261715. [DOI] [PubMed] [Google Scholar]
- Yang J, Bowling JM, Lewis MA, Marshall SW, Runyan CW, Mueller FO. Use of discretionary protective equipment in high school athletes: prevalence and determinants. Am J Public Health. 2005;95:1996–2002. doi: 10.2105/AJPH.2004.050807. [DOI] [PMC free article] [PubMed] [Google Scholar]
- Yang J, Marshall SW, Bowling JM, Runyan CW, Mueller FO, Lewis MA. Use of discretionary protective equipment and rate of lower extremity injury in high school athletes. Am J Epidemiol. 2005;161:511–519. doi: 10.1093/aje/kwi077. [DOI] [PubMed] [Google Scholar]
- Stokes ME, Davis CS, Koch GG. Categorical Data Analysis Using the SAS System. 2nd ed. Cary, NC: SAS Institute; 2000:38.
- Marshall SW. Prevalence and incidence. In: Kempf-Leonard K, ed. Encyclopedia of Social Medicine. Vol 3. New York, NY: Elsevier; 2005; 141–147 .
- Rao JN, Scott AJ. A simple method for analysing overdispersion in clustered Poisson data. Stat Med. 1999;18:1373–1385. doi: 10.1002/(sici)1097-0258(19990615)18:11<1373::aid-sim133>3.0.co;2-f. [DOI] [PubMed] [Google Scholar]
- Zeger SL, Liang KY. Longitudinal data analysis for discrete and continuous outcomes. Biometrics. 1986;42:121–130. [PubMed] [Google Scholar]
- PubMed [database online] Bethesda, MD: National Library of Medicine; 2005.
- DuRant RH, Pendergrast RA, Seymore C, Gaillard G, Donner J. Findings from the preparticipation athletic examination and athletic injuries. Am J Dis Child. 1992;146:85–91. doi: 10.1001/archpedi.1992.02160130087027. [DOI] [PubMed] [Google Scholar]
- Adkison JW, Requa RK, Garrick JG. Injury rates in high school football: a comparison of synthetic surfaces and grass fields. Clin Orthop Relat Res. 1974;99:131–136. [PubMed] [Google Scholar]
- Mueller FO, Blyth CS. North Carolina high school football injury study: equipment and prevention. J Sports Med. 1974;2:1–10. doi: 10.1177/036354657400200101. [DOI] [PubMed] [Google Scholar]
- Garrick JG, Requa RK. Injuries in high school sports. Pediatrics. 1978;61:465–469. doi: 10.1542/peds.61.3.465. [DOI] [PubMed] [Google Scholar]
- Olson OC. The Spokane study: high school football injuries. Physician Sportsmed. 1979;7(12):75–82. doi: 10.1080/00913847.1979.11710899. [DOI] [PubMed] [Google Scholar]
- McLain LG, Reynolds S. Sports injuries in a high school. Pediatrics. 1989;84:446–450. [PubMed] [Google Scholar]
- Prager BI, Fitton WL, Cahill BR, Olson GH. High school football injuries: a prospective study and pitfalls of data collection. Am J Sports Med. 1989;17:681–685. doi: 10.1177/036354658901700516. [DOI] [PubMed] [Google Scholar]
- DeLee JC, Farney WC. Incidence of injury in Texas high school football. Am J Sports Med. 1992;20:575–580. doi: 10.1177/036354659202000515. [DOI] [PubMed] [Google Scholar]
- Gomez JE, Ross SK, Calmbach WL, Kimmel RB, Schmidt DR, Dhanda R. Body fatness and increased injury rates in high school football linemen. Clin J Sport Med. 1998;8:115–120. doi: 10.1097/00042752-199804000-00010. [DOI] [PubMed] [Google Scholar]
- Powell JW, Barber-Foss KD. Injury patterns in selective high school sports: a review of the 1995–1997 seasons. J Athl Train. 1999;34:277–284. [PMC free article] [PubMed] [Google Scholar]
- Gunnoe AJ, Horodyski M, Tennant LK, Murphey M. The effect of life events on incidence of injury in high school football players. J Athl Train. 2001;36:150–155. [PMC free article] [PubMed] [Google Scholar]
- Turbeville SD, Cowan LD, Owen WL, Asal NR, Anderson MA. Risk factors for injury in high school football players. Am J Sports Med. 2003;31:974–980. doi: 10.1177/03635465030310063801. [DOI] [PubMed] [Google Scholar]
- Rothman KJ, Greenland S. Introduction to categorical statistics. In: Rothman KJ, Greenland S, eds. Modern Epidemiology. 2nd ed. Philadelphia, PA: Lippincott Williams & Wilkins; 1998:231–252 .
- Lombardo S, Sethi PM, Starkey C. Intercondylar notch stenosis is not a risk factor for anterior cruciate ligament tears in professional male basketball players: an 11-year prospective study. Am J Sports Med. 2005;33:29–34. doi: 10.1177/0363546504266482. [DOI] [PubMed] [Google Scholar]
- Elandt-Johnson RC. Definition of rates: some remarks on their use and misuse. Am J Epidemiol. 1975;102:267–271. doi: 10.1093/oxfordjournals.aje.a112160. [DOI] [PubMed] [Google Scholar]
- Marshall SW, Spencer RJ. Concussion in rugby: the hidden epidemic. J Athl Train. 2001;36:334–338. [PMC free article] [PubMed] [Google Scholar]
- Hagglund M, Walden M, Bahr R, Ekstrand J. Methods for epidemiological study of injuries to professional football players: developing the UEFA model. Br J Sports Med. 2005;39:340–346. doi: 10.1136/bjsm.2005.018267. [DOI] [PMC free article] [PubMed] [Google Scholar]