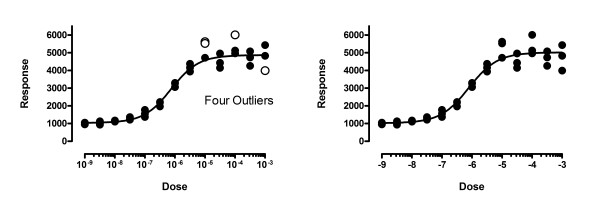
Figure 11.

Don't use outlier elimination if you don't use weighting correctly. The graph shows data simulated with Gaussian scatter with a standard deviation equal to 10% of the Y value. The left panel shows our method used incorrectly, without adjusting for the fact that the scatter increases as Y increases. Four outliers are identified, all incorrectly. The right panel shows the correct analysis, where weighted residuals are used to define outliers, and no outliers are found.
