
Figure 12.
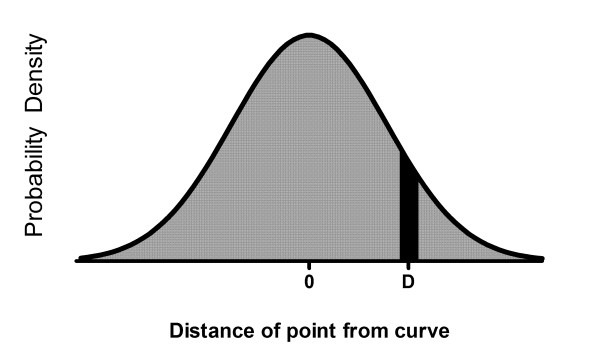
A Gaussian probability density curve. The ratio of the black area to the entire area under the curve is the probability that a value selected from this Gaussian distribution will have a value of D plus or minus ΔD.
Official websites use .gov
A
.gov website belongs to an official
government organization in the United States.
Secure .gov websites use HTTPS
A lock (
) or https:// means you've safely
connected to the .gov website. Share sensitive
information only on official, secure websites.
A Gaussian probability density curve. The ratio of the black area to the entire area under the curve is the probability that a value selected from this Gaussian distribution will have a value of D plus or minus ΔD.