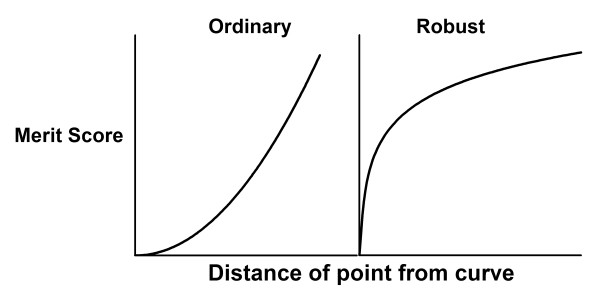
Figure 13.

Why assuming a Lorentzian distribution of residuals makes the fitting process robust. The graph shows the contribution of a point to the merit score for Gaussian (left) and Lorentzian (right) as a function of the distance of a point from the curve. The goal of curve fitting is to minimize the merit score. The curve in the right panel starts to level off. This means that moving the curve a bit closer to, or further from, a point that is already far from the curve won't change the merit score very much. This is the definition of a robust fitting method. In contrast, the curve on the left does not level off, so points far from the curve have a huge impact on least squares fitting.
