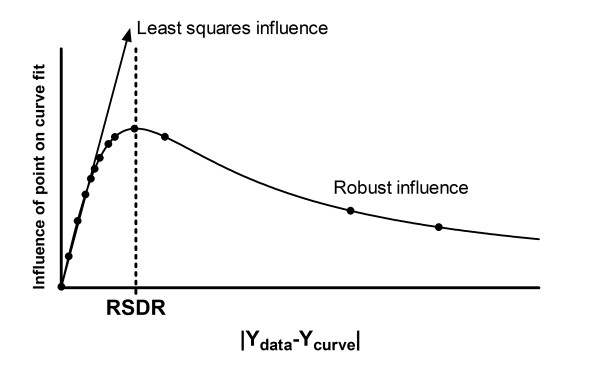
Figure 19.

Worked example. The influence function for robust fitting, after the final iteration. Now that the curve is much closer to most of the points, the RSDR is lower, so the influence curve is shifted to the left. This makes two of the points (to the right) have much less influence than they had at the beginning (compare to Figure 17).
