
Figure 5.
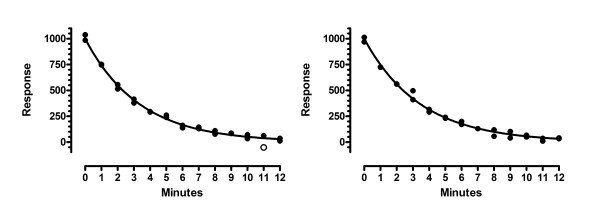
Identifying moderate outliers. These are the first two of 5000 simulated data sets, where the scatter is Gaussian but one outlier was added whose distance from the ideal curve equalled 4.5 times the standard deviation used to simulate the remaining points. Our method detected the outlier in the left panel (with Q set to 1%), and in 58% of 5000 simulations, but did not detect it in the right panel or in 42% of simulations. The False Discover Rate was 0.94%.