
Figure 8.
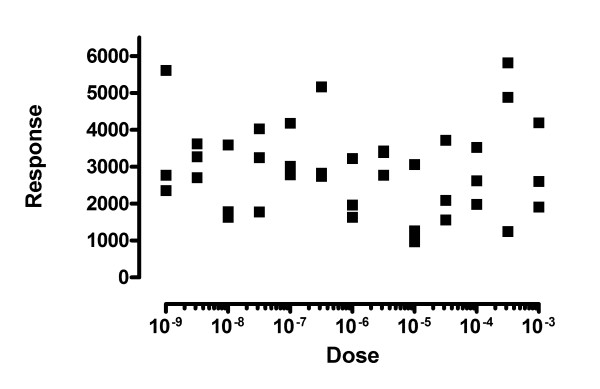
The ROUT method is not fooled by totally random data. These data were simulated from a Gaussian distribution around a horizontal line. Each simulated data set was then fit to a sigmoid dose-response curve, fixing the bottom plateau and slope, and fitting the top plateau and the EC50. Our fear was that our method would define many points to 'outliers' and leave behind points that define a dose-response curve. That didn't happen. Our method found an outlier in only one of 1000 simulations.