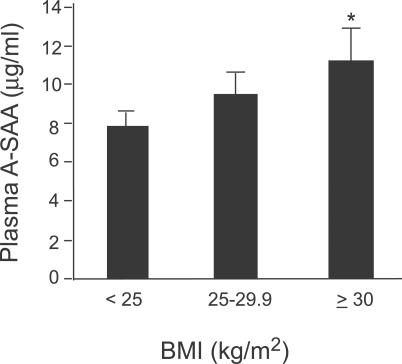
Figure 2. Circulating A-SAA Levels are Positively Correlated with BMI.
A-SAA levels were measured in plasma of normal human participants who were divided into lean (BMI < 25 kg m −2, n = 54), overweight (BMI 25–30 kg m −2, n = 49) and obese (BMI ≥ 30 kg m −2, n = 31) groups. Data are expressed as mean ± SEM (ln-transformed for analysis, back-transformed for presentation), adjusted for age, sex, and family structure. * p = 0.013 versus lean group.

