
Fig. 6.
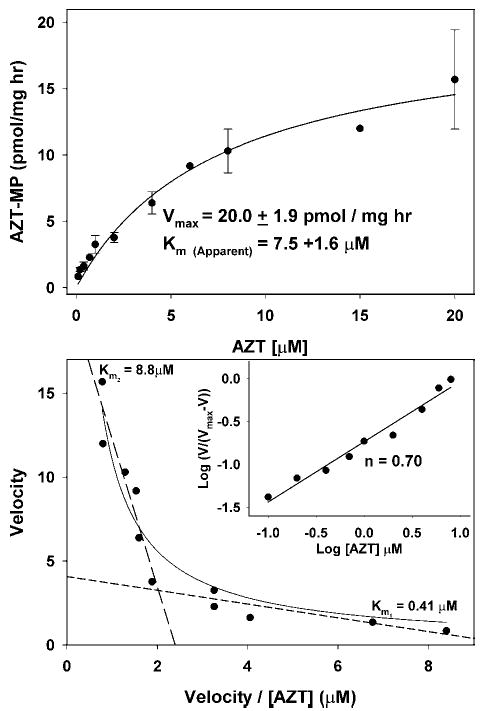
Kinetics of AZT phosphorylation in isolated heart mitochondria. Mitochondria were incubated as described in the Fig. 5 legend, except that [3H]-AZT was used instead of [3H]-thymidine and the concentration of AZT was varied between 0.2 and 20 μM (specific radioactivity 3500–11,000 DPM/pmol). (Top) The rate of AZT phosphorylation was determined by the amount of AZT-MP formed over time as calculated in Fig. 3. The results from three to four experiments are expressed in a standard Michaelis-Menton plot ± SEM and the data fitted to the Michaelis-Menton equation V = Vmax [S]/(Km + [S]), yielding an apparent Vmax of 20.0 ± 1.8 pmol/mg/h and an apparent Km of 7.5 ± 0.4 μM. (Bottom) The results for AZT phosphorylation were treated as described in the Fig. 5 legend for thymidine phosphorylation and indicate that the kinetics of AZT phosphorylation are quite similar to thymidine phosphorylation in Fig. 5, suggesting a negative cooperativity of AZT interaction, which has also been observed by others studying purified and cloned TK2 (23,28). These data can be approximated with two straight lines with slopes corresponding to Km1 = 0.41 μM, and Km2 = 8.8 μM. (Inset) The results are plotted as in Fig. 5 and the negative cooperativity is further supported by a Hill plot slope of <1.