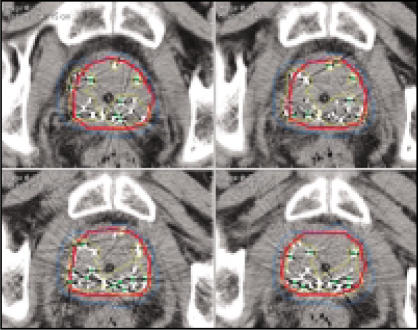
Figure 1.
Computed tomography (CT) images through the middle of the prostate gland. CT performed 2 hours after prostate brachytherapy. The red contour is the prostate outline. The blue line represents the 100% prescription isodose volume. The yellow line represents the 150% prescription isodose volume. Note how the 150% isodose line resides within the peripheral zone and does not include the entire urethra (Foley catheter in place).

