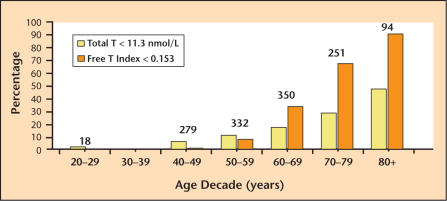
Figure 1.
The prevalence of hypogonadism in the aging male. Each bar indicates the percentage of men in each decade with total testosterone (T) < 11.3 nmol/L (325 ng/dL) (yellow bars) or free testosterone index (total T/sex hormone- binding globulin) < 0.153 (orange bars), both < 2.5th percentile. Numbers over each pair of bars represent the number of men studied in each decade. Adapted with permission from Harman SM et al.2

