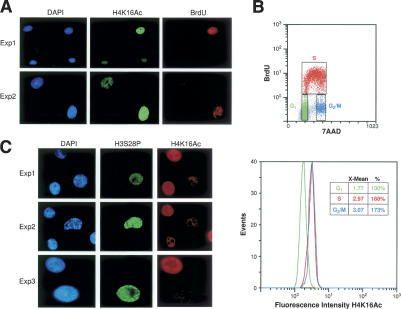
Figure 2.
H4K16Ac levels peak at S phase and drop dramatically in the G2/M transition. (A) Mammalian fibroblasts were pulsed with BrdU, stained with H4K16Ac antibodies as indicated, and analyzed by immunofluorescence for colocalization of BrdU and H4K16Ac. Two different samples are shown (Exp1 and Exp2). (B) Same cells as in A were pulsed with BrdU, incubated with H4K16Ac antibody and 7AAD (DNA content marker), and analyzed by FACS for the levels of H4K16Ac at each stage of the cell cycle. (Upper panel) The distribution of the cells through the cell cycle is represented in relation to BrdU incorporation (Sasaki et al. 1986). Distribution of H4K16Ac levels in cells at each stage of the cell cycle is shown graphically and numerically, with 100% representing the levels of H4K16Ac in G1 phase. (C) Immunofluorescence as in A, but in this case with the mitotic marker H3S28P and H4K16Ac.

