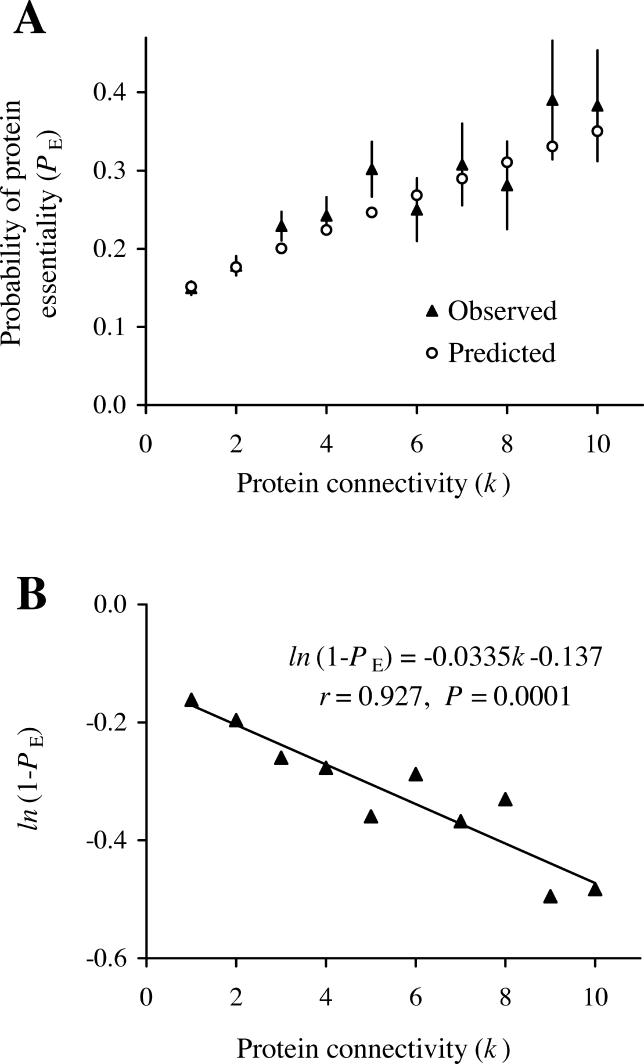
Figure 2. The Relationship between the Probability That a Protein Is Essential (P E) and the Connectivity (k) of the Protein.
(A) Observed and predicted P E values. The observed values were estimated from the yeast PPI network and the predicted values were computed using Equation 1 with parameters α = 2.92% and β = 12.6%. Error bars show one standard (sampling) error of the observed values.
(B) Linear regression between ln(1-P E) and k. Using Equation 2, we estimated from the regression that α = 3.29% and β = 12.8%. The 95% confidence interval for α is between 2.23%–4.35%. The 95% confidence interval for β is between 6.7%–18.6%. Proteins with k > 10 (~ 5% of all proteins) are not considered because of small sample sizes.

