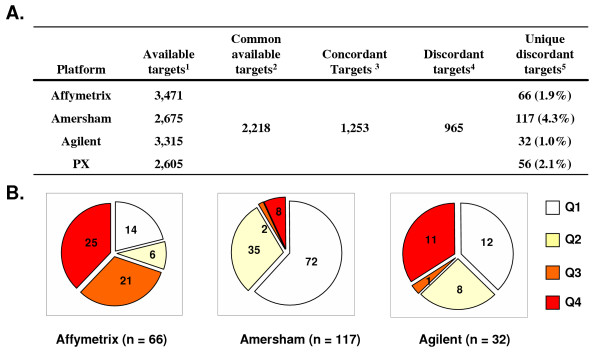
Figure 3.

(A) Summary table of a comparison of the available targets out of the 3.4 K for each platform. 1 The number of targets out the 3.4 K common set that were available for at least one sample for a given platform. 2 The number of targets out the 3.4 K common set that were commonly available for at least one sample for all platforms. 3The number of targets that were attributed with a similar intensity quantiles nomenclature (identical or off by 1 quantile, see Methods) for Affymetrix, Amersham, Agilent and PX. 4 The number of targets that were attributed with a different intensity quantile (off by 2 quantiles) for at least 2 platforms. 5 The number of targets attributed with a different intensity quantile (off by 2 quantiles) for a given platform compared to the other 3 platforms. (B) The fraction of uniquely discordant targets by quantile for each platform with the following color code: white: Q1; yellow: Q2; orange: Q3; red: Q4. The numbers indicate the number of targets that fell into that particular quantile specifically for that particular platform and that should have fallen into another quantile based on the agreement of quantile attribution for those targets between the other platforms.
