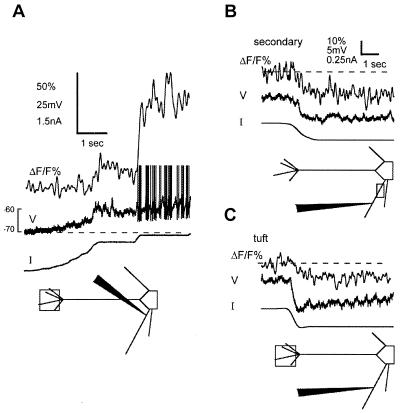
Figure 3.
The steady [Ca2+] level is modulated by membrane potential below rest. Top traces in each panel are ΔF/F%, middle are membrane potential, and bottom are dc current. (A) Depolarization of the mitral cell from approximately −73mV to below the action potential threshold is accompanied by an increase in the steady [Ca2+]. The current injection site was located in a secondary dendrite, and [Ca2+] was measured in the tuft. The action potentials are truncated (B and C); hyperpolarization from threshold by 5–8 mV reduced the steady [Ca2+] level in both the secondary dendrite (B) (near the recording electrode) and the tuft (C) of another cell. Dashed line indicates resting fluorescence levels before changing the membrane potential, and scale bar in B applies to C.

