
FIGURE 2.
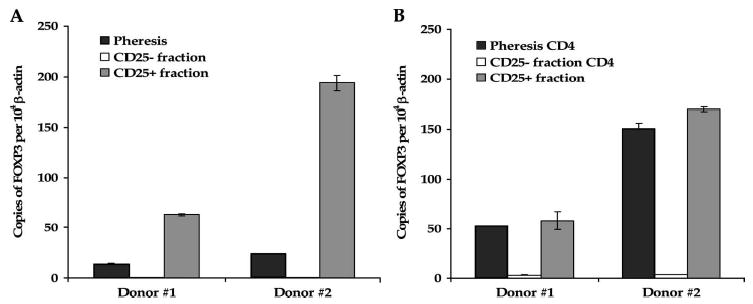
FOXP3 mRNA levels are reduced in CD25-depleted leukapheresis samples. A, Marked differences in FOXP3 expression are noted in post-separation cell fractions. FOXP3 expression was measured in pre- and post-separation leukapheresis products from donors 1 and 2 by TaqMan RT-PCR. B, Similar differences in FOXP3 expression are present in CD4-enriched T-cell population. FOXP3 expression was measured in CD4-enriched pre- separation and CD25-depleted cells, and non-enriched CD25+ fraction cells, which primarily comprised CD4+ T cells (see Fig. 1A). Results represent the relative number of FOX3 copies per 104 copies of β-actin ± SEM.