
FIG. 3.
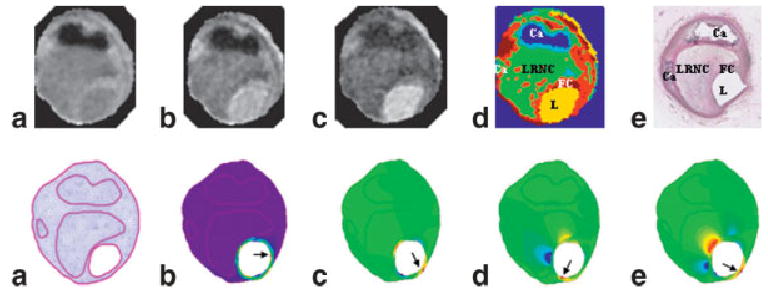
Illustration of the procedure for the creation of biomechanical maps using MR images of coronary atherosclerotic plaque specimens. Top: a– c are MR images obtained with TE of 20, 40, and 70 ms; d: a segmented color map that can be compared with the histologic image (e). Bottom: a mesh map (a) can be created based on the MR segmented image; biomechanical maps are shown in the following order: τP1 (b), τxy (c), σxx (d), and σxy (e). The arrows point to the pixels with maximum values. Notice that maximum values are often located close to the thinnest cap or shoulder of the plaque. The locations of these maximum pixels are also different in these maps.