
FIGURE 1.
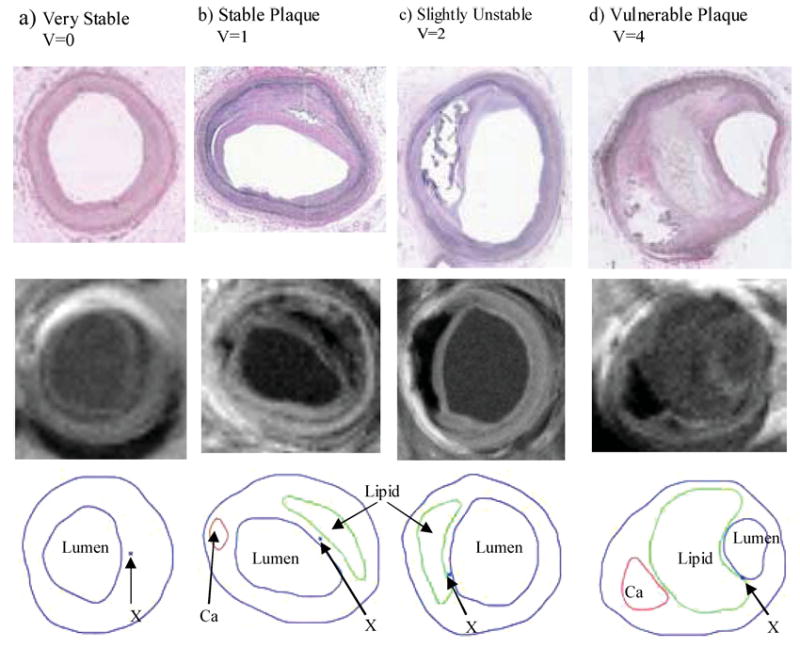
Histological (upper) and MR (middle) images and segmented contour plots (lower) of selected sample plaques with various degrees of vulnerability as classified by histopathological analysis. Critical sites (explained later) are indicated by “X.” (a) a remarkable stable plaque used as the baseline case; (b) a well-caped stable plaque, V = 1; (c) an unstable plaque with a large lipid core and thin cap; (d) a vulnerable plaque with a huge lipid-rich necrotic core, a separate Ca deposit, and a very thin cap near lumen with many inflammatory cells.