
FIGURE 7.
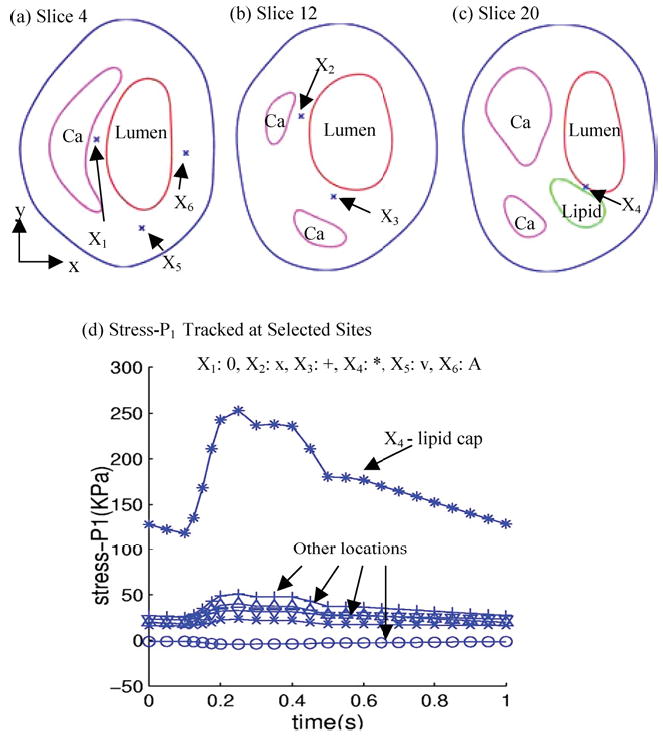
Tracking of stress components at selected sites under pulsating pressure showing critical site at the thin lipid cap has much greater stress variations. (a–c) Normal and critical sites selected to track stress/strain variations. X1: calcification cap; X2: thicker Ca cap; X3: thicker Ca cap; X4: thin lipid cap (most vulnerable site); X5: normal point to observe stress-xx; X6: normal point to observe stress-yy; (d) Stress variation at the thin cap site is much greater (>400%) than that at other sites.