
Fig. 3.
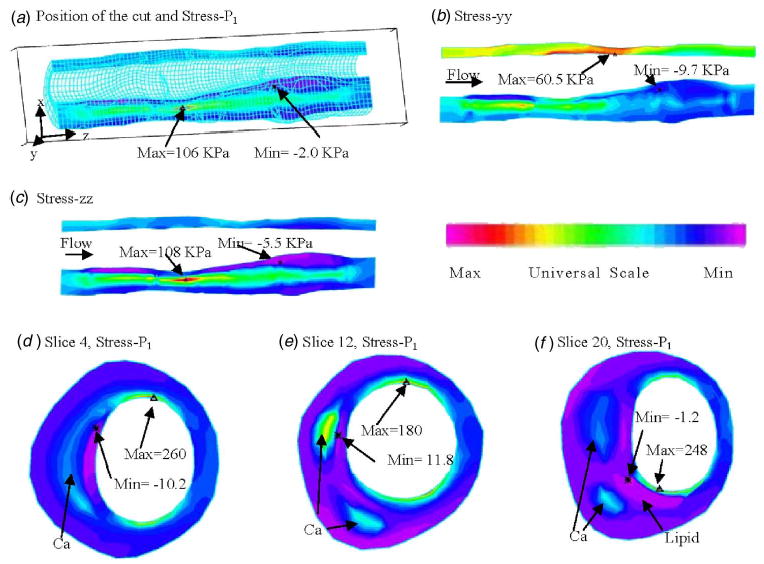
Band plots of selected stress components from the 3D FSI baseline model on a sagittal slice and three cross-section cuts showing that the large calcification block has considerable effect on stress distributions. P in =150 mm Hg, P out =126 mm Hg, axial stretch=10%. (a) Position of the cut and band plot of stress-P 1 showing calcification has higher stress level. Stress maximum occurred at a location where vessel wall is thin; (b) band plot of circumferential stress distribution. Maximum is found at the healthy side of the vessel (vessel is thin there); (c) band plot of longitudinal tensile stress; (d) stress-P 1 on slice 4; (e) stress-P 1 on slice 12; (f) stress-P 1 on slice 20.