
Fig. 8.
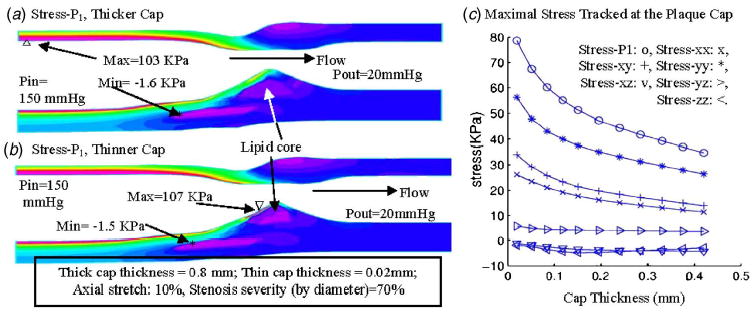
Thinner plaque cap leads to higher stress level: quantitative study. (a) Stress-P 1 in plaque with thicker cap; (b) maximum of stress- P 1 appeared at the plaque cap when cap thickness was reduced to 0.02 mm; (c) maximal values of stress-P 1 increases almost exponentially when cap thickness decreases. Eleven cases were simulated using the 70% modified plaque sample with cap thickness adjusted incrementally from 0.02 to 0.42 mm. P in =90–150 mm Hg, P out =20 mm Hg. Only the stress values at P in =150 mm Hg are shown.