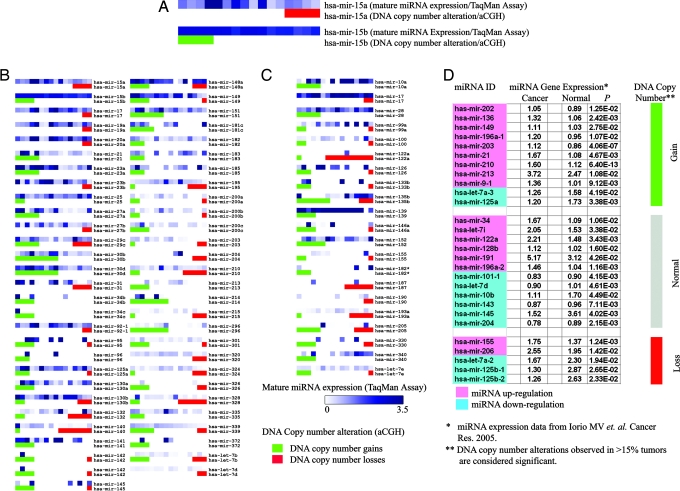
Fig. 4.
Correlation analysis between DNA copy number alteration and miRNA expression. (A–C) Expression of mature miRNA transcripts (by TaqMan miRNA assay) and DNA copy number of loci containing the specific miRNA (by aCGH) in 16 ovarian cancer cell lines. (A) Higher magnification of mir-15a and mir-15b maps. Each spot represents a cell line. Expression levels of mature miRNA transcripts are presented in the upper lane as a heat map in 16 cell lines. DNA status is presented in the lower lane (red, DNA copy number loss; green, DNA copy number gain). Cell lines are ranked based on DNA status (leftmost, amplified; middle, normal; rightmost, deleted gene copy). (B) miRNA genes (n = 57) showing concordance between DNA copy number alterations and miRNA transcript expression. (C) miRNA genes (n = 21) showing no concordance. (D) Comparison of miRNA aCGH data from the present tumor set with expression data of 28 miRNAs overexpressed in a different breast cancer set, as reported by Iorio et al. (50). miRNA genes with normal DNA copy number are marked in gray; gains are marked in green, and losses in red. miRNA transcript overexpression (relative to normal breast) is marked in pink; underexpression (relative to normal breast) is in blue (50).

