
Figure 8. Tissue distribution of DCVC in rat urine.
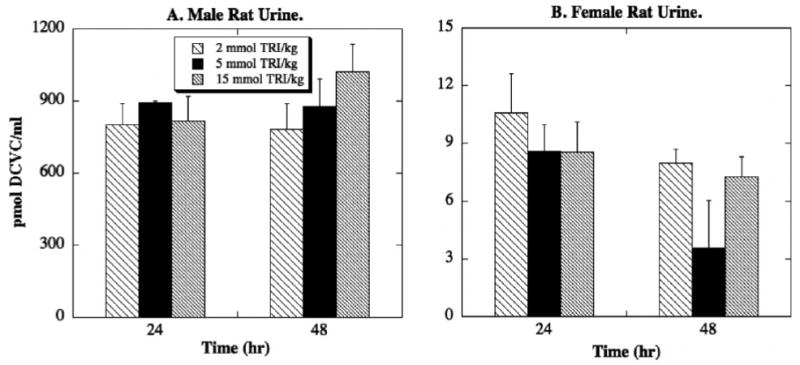
Male and female F344 rats (175–225 g body weight) were exposed to one of three doses of TRI (2, 5, 15 mmol/kg body weight in 1 ml corn oil) by oral gavage. Animals were kept in metabolic cages for up to 48 hr. Due to the nature of the fluid sampling, each time point was represented by a separate animal. Results are means ± SE of measurements from 3 animals for each data point. The limit of detection was 1.1 pmol/ml.