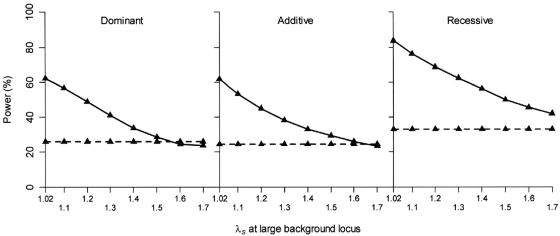
Figure 5.
Power comparison of case-control design and one sibling per ASP–control design, under five-locus disease models, when the effect size of the large-effect background disease locus increases and the effect size of the small-effect disease loci, including the test locus, is fixed. Results are based on 2,000 replicate data sets. The disease prevalence K=5%. The disease is influenced by five unlinked disease loci, each with a predisposing-allele frequency of 0.1. The SNP, with a minor-allele frequency of 0.1, is completely linked to the first disease locus, and r2 between the two loci is 0.5. All disease loci follow a dominant, an additive, or a recessive model, with locus-specific fixed λs at the large effect background disease locus increasing from 1.02 to 1.7 and the locus-specific λs for the small effect disease loci, including the testing locus, fixed at 1.02. Power is assessed at the 1% level. The solid line is for design with 500 cases (one sibling per ASP) and 500 controls. The dashed line is for design with 500 cases and 500 controls.

