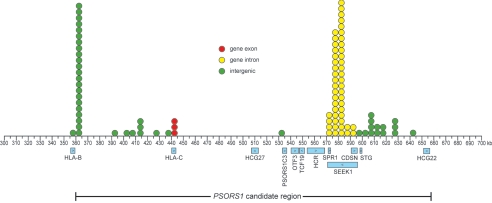
Figure 3.
Locations of polymorphisms unique to risk haplotypes within the PSORS1 candidate region. Polymorphisms with alleles borne by the two sequenced risk haplotypes that differ from the alleles borne by all eight sequenced nonrisk haplotypes are plotted, with circles, to the nearest 5-kb interval. Fill color of the circle indicates whether the polymorphism occurs within a gene exon (red), gene intron (yellow), or intergenic region (green). Known genes and their direction of transcription and the PSORS1 candidate interval are shown below the coordinate axis.

